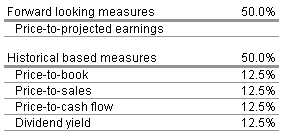
Value factor weights:

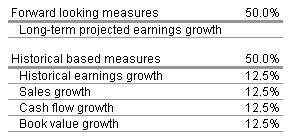
Growth factor weights:

4What are the key elements of the calculation?
The methodology uses a 10-factor model to determine the style of an individual stock. Separate value and growth scores, each based on five factors, are calculated for each stock. In calculating each score, the methodology places 50 percent weight on the forward-looking measure and 50 percent weight on four historical-based measures.
The five value factors are price-to-projected earnings, price-to-book, price-to-sales, price-to-cash flow, and dividend yield. The growth score is calculated independent of price, using these five factors: long-term projected earnings growth, historical earnings growth, sales growth, cash flow growth, and book value growth.
Securities are classified as value or growth based upon the dominant score. If neither score is dominant, the stock is classified as core.
The style attributes of stocks within a fund are rolled up to determine the fund�s overall investment style. Funds are classified as value, growth, or blend.
For stocks, the central column of the Style Box represents the core style; for funds, the central column represents the blend style (a mixture of growth and value stocks or mostly core stocks).
Stocks are divided into seven style zones based on their country of domicile. Morningstar defines large-cap stocks as those that account for the top 70 percent of the capitalization of the style zone; mid-cap stocks represent the next 20 percent; and small-cap stocks represent the balance.
4How are the 10 value and growth factors weighted?
Value factor weights:

Growth factor weights:

4Are components of the value or growth scores subjective?
We use earnings forecasts, based on consensus estimates from industry analysts, which are important in calculating stock growth orientation. They also affect the projected earnings factor used in the value orientation calculation. There is no subjective treatment of this input in the Morningstar methodology. Consensus estimates are incorporated "as is" into the calculation of growth and value orientations. Individual Morningstar analyst opinions are not used.
4Is the same methodology used for U.S. and foreign stocks?
The Morningstar Style Box is applicable in all equity markets. The equity sample used in the style box calculation includes over 20,000 stocks from 70 different countries. These equity markets are categorized into seven style zones: United States, Latin America, Canada, Europe (includes Africa), Japan, Asia ex-Japan, and Australia/New Zealand. Market capitalization breakpoints are determined for each style zone, and Overall Value and Growth scores are then calculated for each stock.
4How are the market cap breakpoints determined?
Stocks are first divided into seven style zones based on their country of domicile. Within each zone, the market cap of each stock is converted to a common currency, the stocks are organized in descending order by size, and the cumulative capitalization as a percentage of total sample capitalization is calculated as each stock is added to the list.
The stock that causes cumulative capitalization to equal or exceed 40% of the style zone�s total cap is the final one assigned to the giant-cap group. The largest of the remaining stocks are assigned to the large-cap group until cumulative capitalization equals or exceeds 70% of the total capitalization of the style zone. The largest of the remaining stocks are assigned to the mid-cap group until cumulative capitalization equals or exceeds 90% of the total capitalization of the style zone. The remaining stocks are assigned to the small-cap group.
4Does Morningstar have separate Style Boxes for stocks and funds?
The underlying methodology for classifying stocks and funds is the same. However, investors will see slight differences in the Style Box nomenclature.
The Morningstar Style Box is a nine-square grid � three stock investment styles for each of three size categories: small, mid and large. Two of the three style categories are value and growth. However, the third, central column definition differs: for funds, the central column represents blend funds, which include value, core and growth stocks; for stocks, it represents core stocks, those for which neither growth characteristics nor value characteristics are dominant.